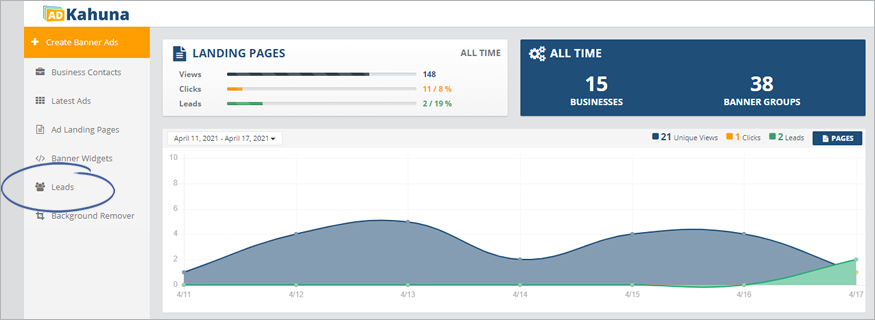
Your Leads Analytics Panel displays all the Leads that went through on your Landing Page. This panel displays the total: Clicks, Leads, and the Conversion Percentage from the last seven to ninety days.
Click Leads from the main dashboard to access your Leads Analytics Panel.
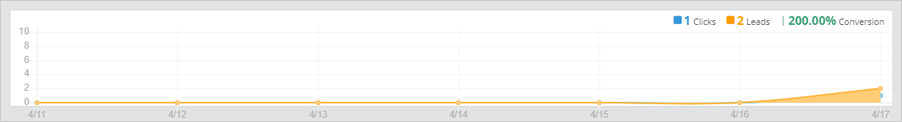
The Analytics Graph displays the total: Clicks, Leads, and the Conversion Percentage of your Landing Page for the past seven to ninety days, which depends on the filter that you have set.
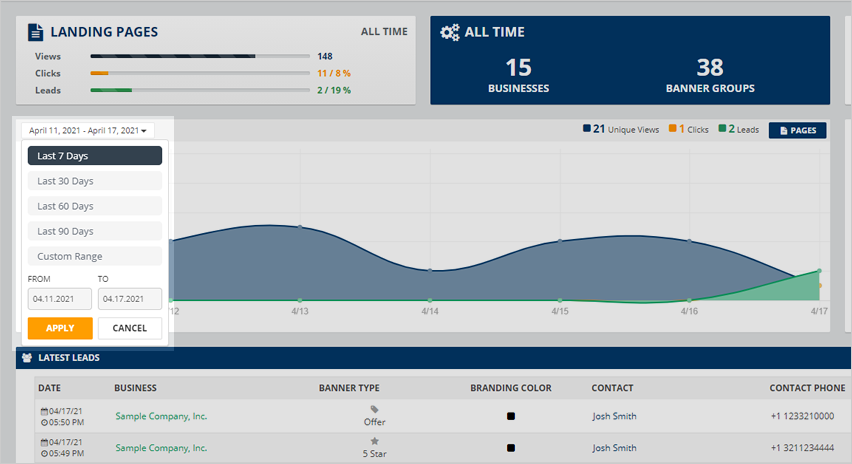
Click the date filter to display the stats from the last seven to ninety days or even add a custom date range on this panel.
Related Articles:
Leads Contact Card Preview in Ad Kahuna
How to Add a New Company from Your Leads
Lead Wizard Heat Map
Open Leads Record
Closed Leads Record
Exporting Leads to CSV