This article provides an overview of the Email Leads Dashboard inside Lead Kahuna.
Access this dashboard by clicking Email Leads from the Lead Kahuna Main Dashboard.

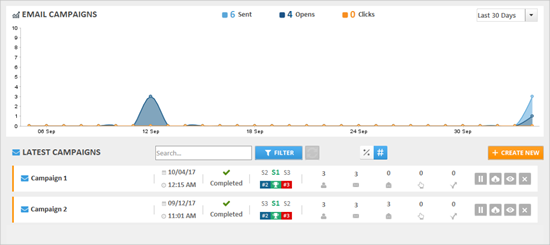
This is the top section of the page. This section displays a graph of all your campaign activity data for the last 30 days. From here, you can see:

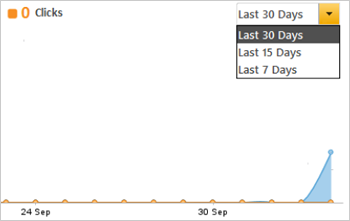
From the top right-hand corner, you can sort the data by the last 30, 15, or 7 days.
This is the list of your latest trailing campaigns. From here, you can see each campaign and monitor the progress of your campaigns.

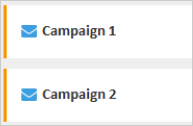
This section displays the names of your campaigns.
This displays the date and time your campaign was sent.

This displays the statuses of your campaigns. While your campaign is still sending, you will see a cog wheel. Once your campaign is completed, you will see a check mark.

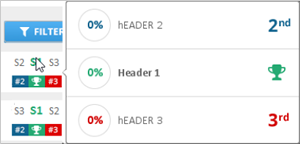
In the new version of Email Leads, we added Subject Line Split Testing, which shows you which Subject Line is performing best. Your Subject Lines are ranked from 1 to 3, which based on which one has the best open rates.

To see more detailed information, hover your mouse on the subject lines. Then, you will see:
This displays the data of your campaigns, which you can quickly see. From here, you can see:
 ) .
) .
 ).
).
 ).
).
 ).
).
 ).
).
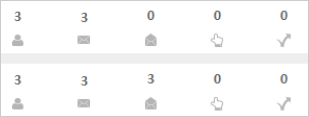
To filter your campaign to percentage, click ( ). To see the exact numbers of your campaign, click (
 ).
).
Percentages
|
Numbers 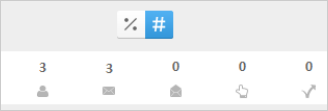
|
This lets you search for a campaign. Just type the name of the campaign and click Filter to search for a specific campaign.
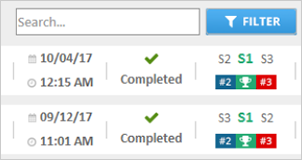
This is the last part of your Email Campaign table, which lets you apply different actions to your campaign.

 ) to pause that campaign, which will stop.
 ) to download the overview of the campaign.
 ) to see the details of your campaign. This will bring you to the details of your campaign. See:
 ) to remove a campaign from your campaign list. Click Yes to confirm your action.