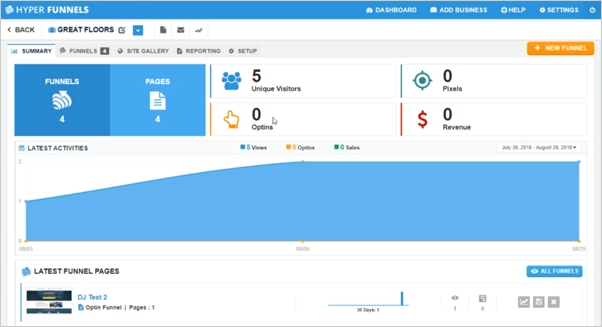
The Business Dashboard is a great way to manage your clients and view the information about a specific client. This page lets you quickly see metrics around:
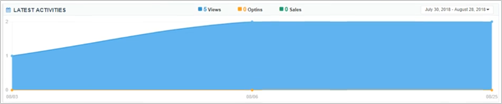
This page displays the analytics Latest Activities. It displays the Total Views, Optins, and Sales through a graph.
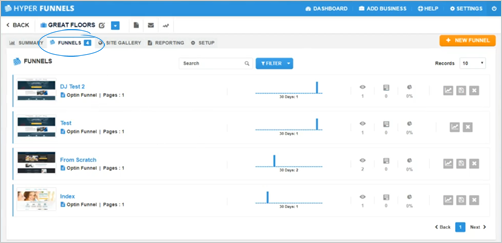
It also displays a breakdown per funnel and helps display recent activity, details about each funnel and ability to navigate to the Funnel Dashboard.

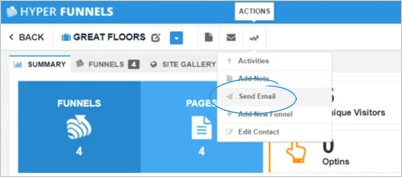
More can be done in this page by having direct communication with your client through the ‘Send Email’ feature.
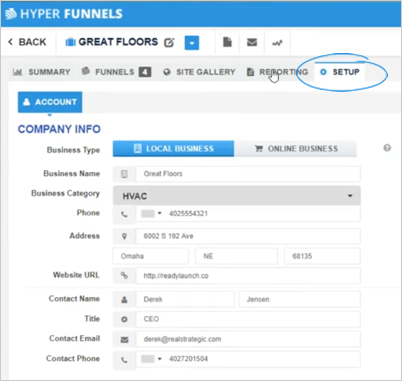
To edit the Business information, click the ‘Setup’ tab.
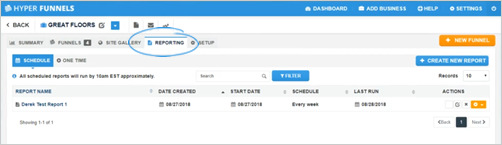
To create a report for this specific business, click the ‘Reporting’ tab.
Here is an article on how to create How to Create a Report (Click Here)
To manage the media assets for this business, click the ‘Site Gallery’ tab. The Site Gallery works for you by scraping the website you specified for this business. It will pull the images in for you to use on your new funnel page.

To work with the Funnel Management, click the ‘Funnels’ tab.